
Figure 5.
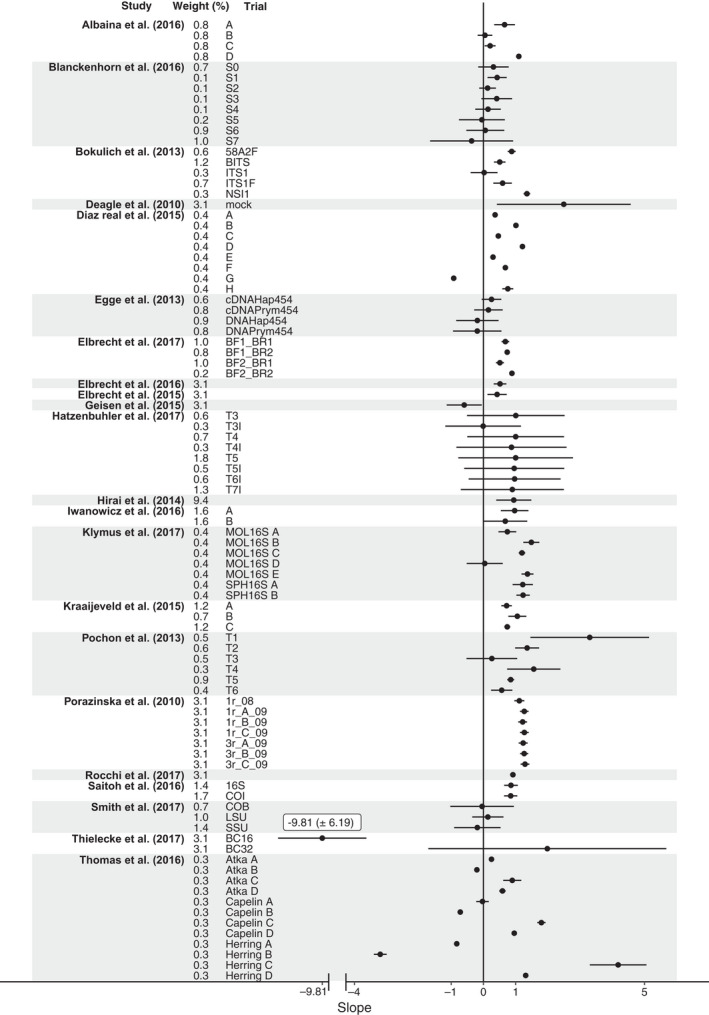
Forest plot showing the slope estimates for all trials in the meta‐analysis (± variance of slope). Trials are clustered at the paper level denoted by the grey and white shading
Official websites use .gov
A
.gov website belongs to an official
government organization in the United States.
Secure .gov websites use HTTPS
A lock (
) or https:// means you've safely
connected to the .gov website. Share sensitive
information only on official, secure websites.
Forest plot showing the slope estimates for all trials in the meta‐analysis (± variance of slope). Trials are clustered at the paper level denoted by the grey and white shading