
Figure 1.
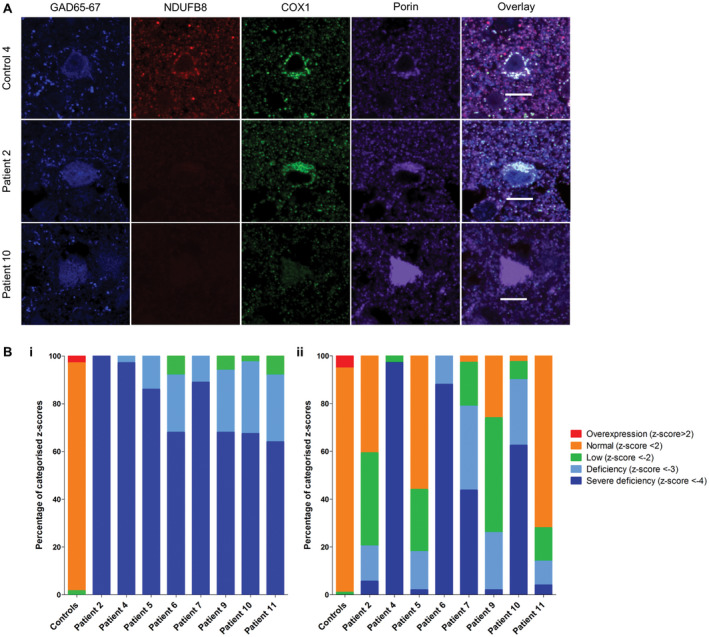
Downregulation of NDUFB8 and COX1 expression levels in patient GAD65‐67‐positive interneurons in occipital cortex. Representative images reveal downregulation of NDUFB8 and COXI expression levels relative to mitochondrial mass marker porin in patient inhibitory interneurons A. Scale bar = 10 microns. Quantitative analysis reveals the mitochondrial respiratory chain expression profiles for each patient and confirms higher percentage levels of NDUFB8 (unpaired t‐test, P < 0.0001) B.i. and COXI (unpaired t‐test, P < 0.0005) B.ii. deficiencies in interneurons.