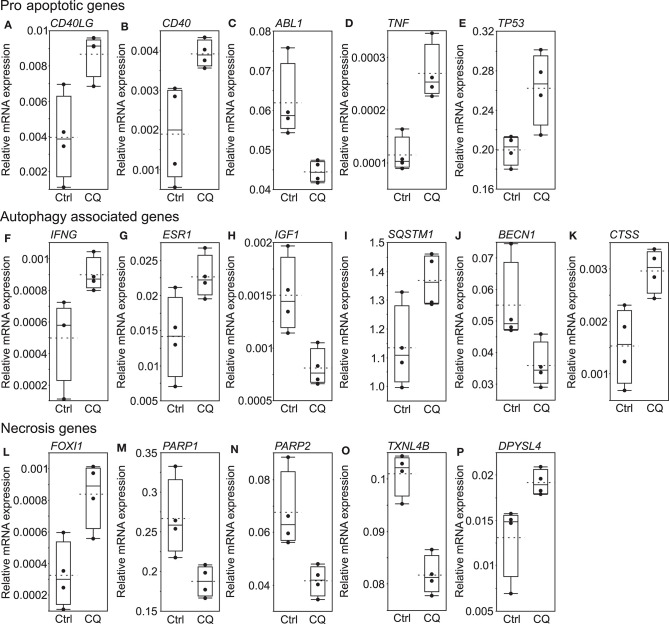
Figure 4.
Significantly altered genes detected by Cell Death Pathway Finder array. Pro-apoptotic genes (A–E), autophagy associated genes (F–K), necrosis genes (L–P). Black dots represent normalized expression of independent samples, the box represents the interquartile range, and the whiskers represent the first and fourth quartile. The solid line is median and dashed line shows mean expression of each gene after 96 h of 5 μM CQ or control treatment (N = 4).

