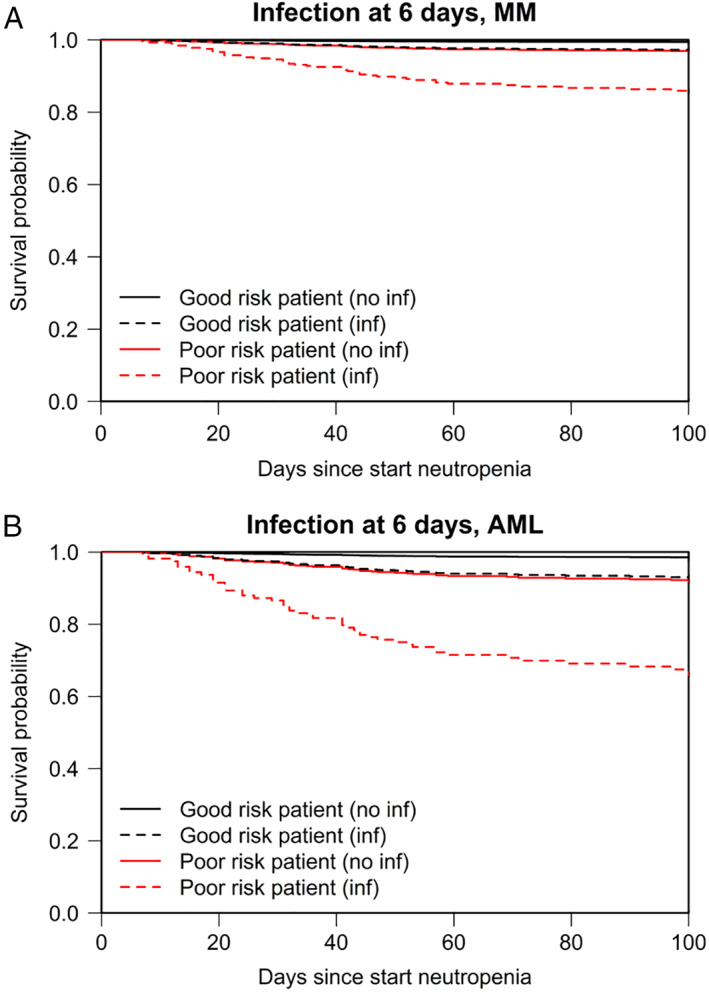
Figure 3.

Predicted survival in reference patients. Model‐based predicted survival is shown for reference patients with multiple myeloma (A) and with AML (B). The model is presented in Table 4. The solid lines show the predicted survival for patients who do not develop an infection. The dashed lines show how the survival probabilities change if the patients develop an infection at 6 days after start of neutropenia. Six days was chosen as this is the median time to develop invasive infections after start of neutropenia. Good risk is defined as patients with WHO comorbidity score 0 and HCT‐CI score of 0. Poor risk, WHO score 1, HCT‐CI ≥ 2.
