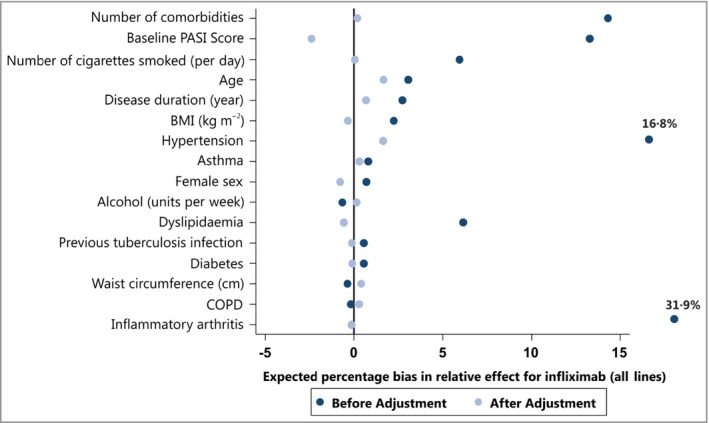
Figure 1.

Forest plot showing the reduction in expected percentage bias for the individual covariates after inverse probability treatment weighted propensity score weighting.
PASI, Psoriasis Area and Severity Index; BMI, body mass index; COPD, chronic obstructive pulmonary disease.
