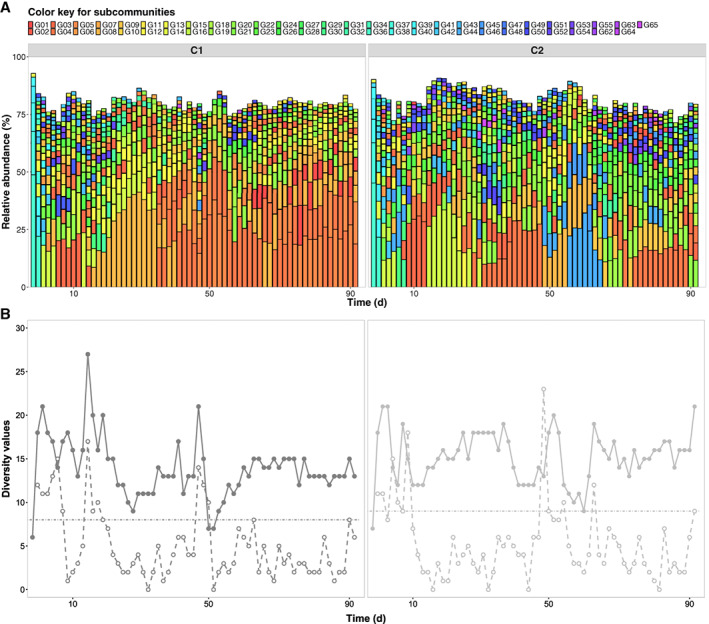
Figure 2.

Community analysis based on dominant subcommunities in samples taken from control reactors C1 and C2. A. Variations of community structures through time were displayed as successive columns. Each column represents a community sample where dominant subcommunities are shown as squares filed with unique colours. The length and position of a square indicate the corresponding dominant subcommunities with its relative abundance value and the rank‐order of this abundance value (relative abundances of dominant subcommunities per sample displayed in decreasing order from bottom to top). B. Values of cytometric α‐diversity (solid points) and intra‐community β‐diversity (empty points) measured through the time. The threshold (dashed line) for recognizing drifts was defined regarding to the maximum of intra‐community β‐diversity values in reference spaces which were 8 for C1 and 9 for C2.
