
Figure 4.
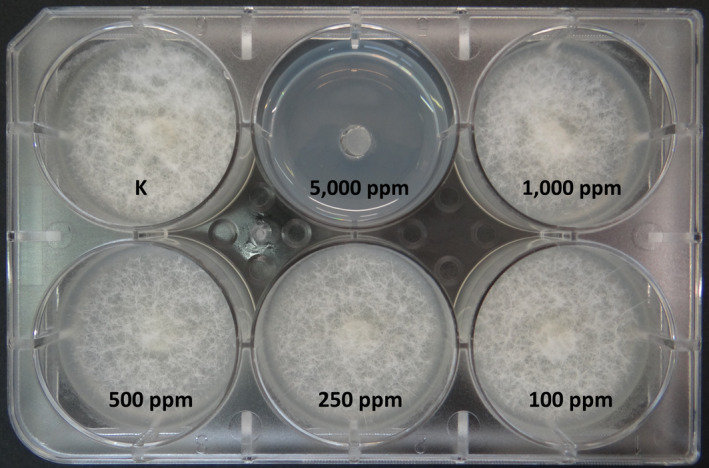
Mycelial growth after 6 days with different concentrations of hydrogen peroxide in agar, showing minimum inhibitory concentration at 5,000 ppm [Colour figure can be viewed at wileyonlinelibrary.com]
Official websites use .gov
A
.gov website belongs to an official
government organization in the United States.
Secure .gov websites use HTTPS
A lock (
) or https:// means you've safely
connected to the .gov website. Share sensitive
information only on official, secure websites.
Mycelial growth after 6 days with different concentrations of hydrogen peroxide in agar, showing minimum inhibitory concentration at 5,000 ppm [Colour figure can be viewed at wileyonlinelibrary.com]