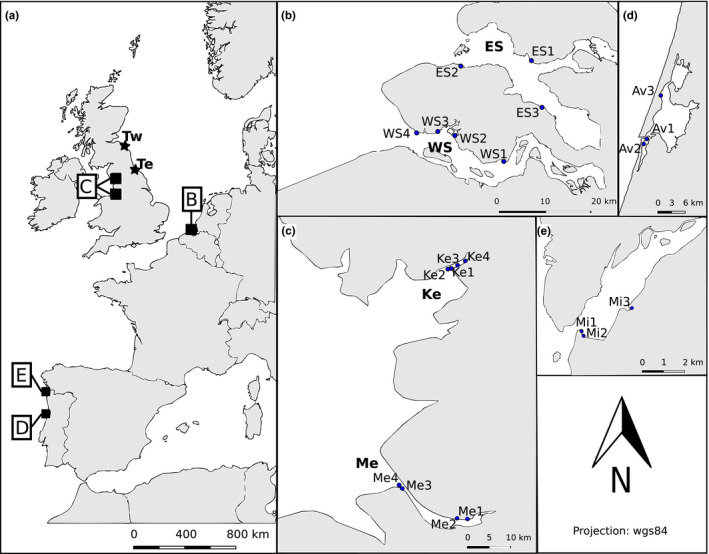
Figure 1.

Overview of sample locations, illustrating (a) the overall western European scale, including the location of the Tweed (Tw) and Tees (Te) estuaries, marked by stars (where the study comparing fish detection performance of stomach, sediment, water DNA and traditional netting took place); (b) the Dutch estuaries, Western Scheldt (WS) and Eastern Scheldt (ES); the British estuaries (c), Mersey (Me), Kent (Ke) (Tees and Tweed only present in inset a); the Aveiro (d) and Minho (e) estuaries in Portugal. Small numbered dots within estuaries represent individual collection points for shrimp and sediment samples. Source map: OpenStreetMap [Colour figure can be viewed at wileyonlinelibrary.com]
