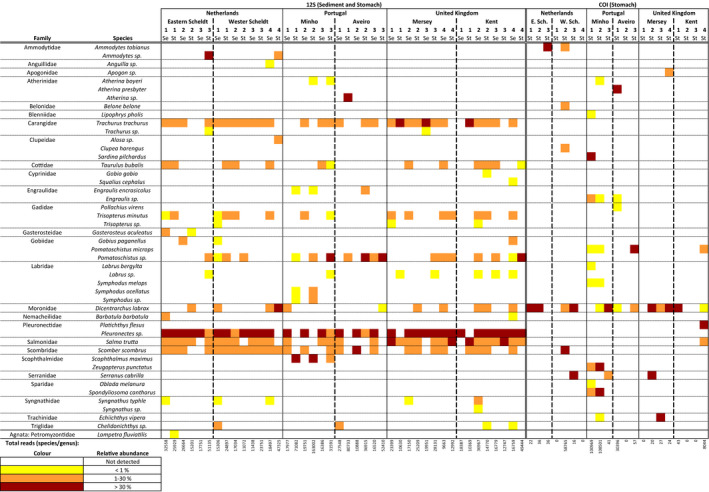
Figure 2.

Heatmap of fish species and genera detected in samples taken from Dutch (E. Sch: Eastern Scheldt & W.Sch: Western Scheldt), UK (Mersey & Kent) and Portuguese (Minho & Aveiro) estuaries. The heatmap only shows taxa that are identified at the genus or species level. Fish taxa detected in Crangon crangon pooled stomach samples (St) are shown after DNA amplification with two markers: 12S and COI. Sediment samples (Se) are only shown after DNA amplification with the 12S primers since COI amplification resulted in the detection of only 1 MOTU (D. labrax) in 1 sample (Minho 1). Colours represent differences in relative read abundances, and the numbers below the columns show the total number of fish reads per sample that could be assigned to the species or genus level [Colour figure can be viewed at wileyonlinelibrary.com]
