
Figure 3.
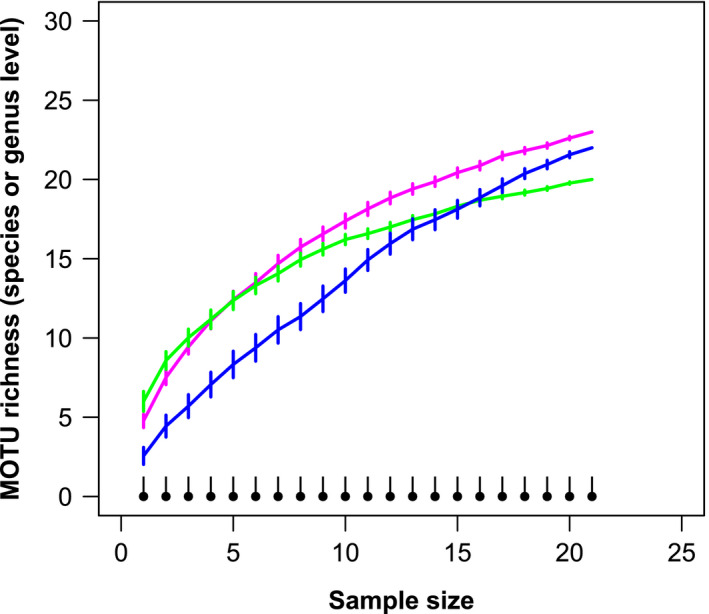
MOTU accumulation curves (±SE; 100 permutations) representing the number of bony fish MOTUs identified at the species or genus level detected in sediment and Crangon crangon pooled stomach samples analysed with two different markers. Green: Sediment—12S; pink: Stomach—12S; black: Sediment—COI; blue: Stomach—COI. Sediment—COI values are estimated since only 1 MOTU was detected [Colour figure can be viewed at wileyonlinelibrary.com]