Figure 12.

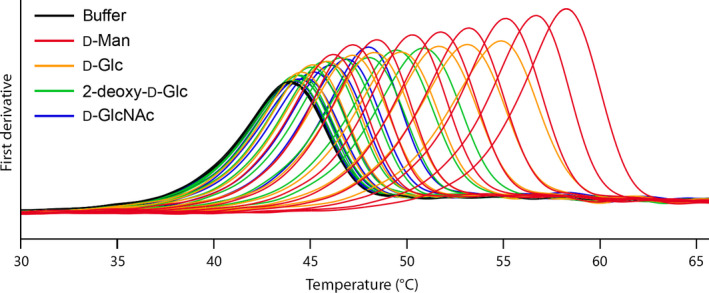
Exemplary T m measurements of HK (black) in the presence of d‐mannose (red), d‐glucose (yellow), 2‐deo‐d‐glucose (green), and N‐acetyl‐d‐glucosamine (blue) in increasing concentrations of 0.05, 0.1, 0.2 0.5, 1, 2, 5, 10 and 20 mm each.

Exemplary T m measurements of HK (black) in the presence of d‐mannose (red), d‐glucose (yellow), 2‐deo‐d‐glucose (green), and N‐acetyl‐d‐glucosamine (blue) in increasing concentrations of 0.05, 0.1, 0.2 0.5, 1, 2, 5, 10 and 20 mm each.