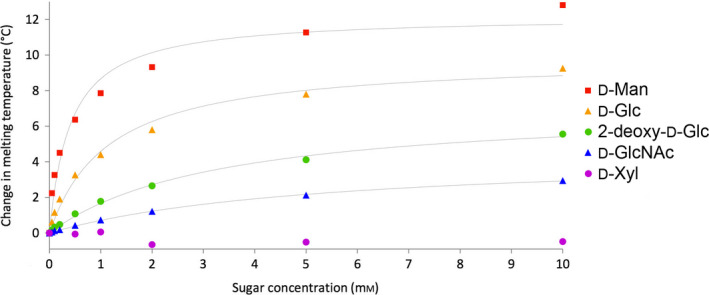
Figure 13.

Change in T
m of hexokinase in the presence of different sugars. The trend line was fitted to the modified Michaelis–Menten kinetics given in Eqn (1). The stabilisation effect could be used to estimate affinity of substrates or potential inhibitors (K
M or K
i). Symbols represent  d‐mannose,
  d‐glucose,
  2‐deoxy‐d‐glucose,
  N‐acetyl‐d‐glucosamine and
  d‐xylose.
