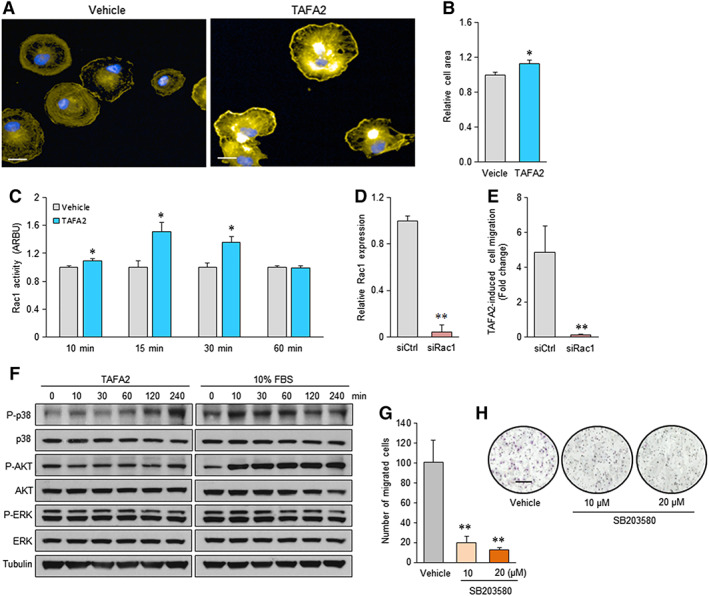
Figure 2.

TAFA2‐induced lamellipodia formation and enhanced Rac1‐p38 signaling in cultures of human skeletal (mesenchymal, stromal) stem cells (hMSC). (A, B): Analysis of cell morphology of phalloidin‐stained hMSC cultures using Operetta high‐content imaging system and cell area quantitation at single‐cell level. Scale bar: 10 μm. Data represent mean ± SEM from three independent experiments. *, p ≤ .05, two‐tailed unpaired Student t test. (C): Quantitation of Rac1 activity in hMSC cultures, 10, 15, 30, and 60 minutes after stimulation with TAFA2 (10 μg/ml). (D): Quantitative reverse transcription polymerase chain reaction analysis of Rac1 expression in hMSC cultures transfected with siRac1 or siCtrl. Data represent mean ± SEM from three independent experiments. **, p ≤ .01, two‐tailed unpaired Student t test. (E): Quantitation of TAFA2‐induced trans‐well migration of hMSC transfected with siCtrl or siRac1. Data represent mean ± SEM from three independent experiments. *, p ≤ .05; **, p ≤ .01, two‐tailed unpaired Student t test. (F): Western blot analysis of P‐p38, p38, P‐Akt, Akt, P‐ERK, ERK, and tubulin in lysates from hMSC cultures at different time points after stimulation with TAFA2 (10 μg/ml) or 10% fetal bovine serum. Data are representative of two independent experiments. (G, H): Quantitation of TAFA2‐induced trans‐well migration in hMSC cultures pretreated with vehicle or p38 small molecule inhibitor (SB203580; 10 and 20 μM). Photomicrographs show Hemacolor staining of the migrated hMSC. Scale bar: 50 μm. Data represent mean ± SEM from three independent experiments. **, p ≤ .01, two‐tailed unpaired Student t test. Abbreviation: ARBU, arbitrary unit; siCtrl, control nontargeting small interfering RNA; siRac1, small interfering RNA against Rac1.
