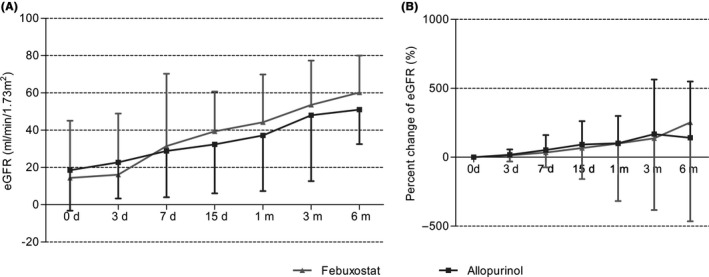
Figure 5.

Effects of febuxostat and allopurinol on A, estimated glomerular filtration rates and B, percentage changes of eGFR for early post‐renal transplant recipients after initial treatment. eGFR is expressed in mL/min/1.73 m2, values are given as median ±interquartile range except values of febuxosta group and allopurinol group in month 6 are given as mean ± standard deviation. Values in figure (B) are given as mean ± standard deviation
