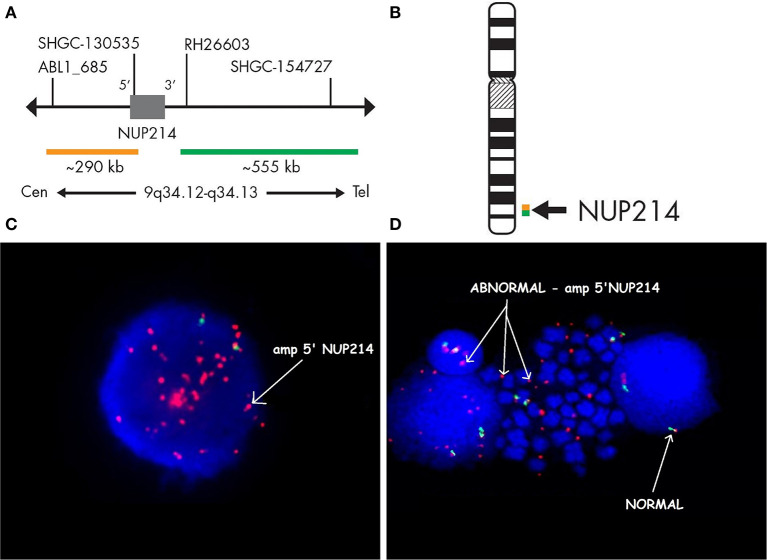
Figure 4.
Fluorescence in situ hybridization revealing an amplification of NUP214. SPEC NUP214 probe map (A). Ideogram of chromosome 9 indicating the hybridization locus (B). Images of the FISH results with the ZytoLight-SPEC NUP214 Dual Color Break Apart Probe revealing NUP214 amplification (C,D). FISH was performed on both interphase (C) and metaphase cells (D). Cells displaying NUP214-ABL1 amplification are shown (arrows). Normal cells exhibited two red/green signals (arrows). Episomes are represented as small dots between chromosomes (D).

