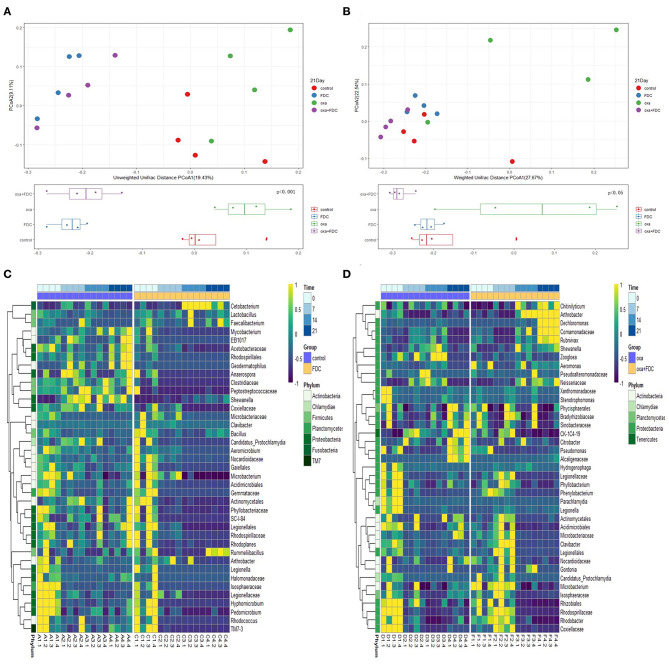
Figure 4.
Effects of FDC administration on the gut microbiota composition. (A,B) A principal component (PCoA) score plot based on unweighted and weighted UniFrac metrics for all samples on day 21. Each point represents the composition of the intestinal microbiota of one sample. (C,D) Heatmap constructed using the number of significantly different species on days 0, 7, 14, and 21.

