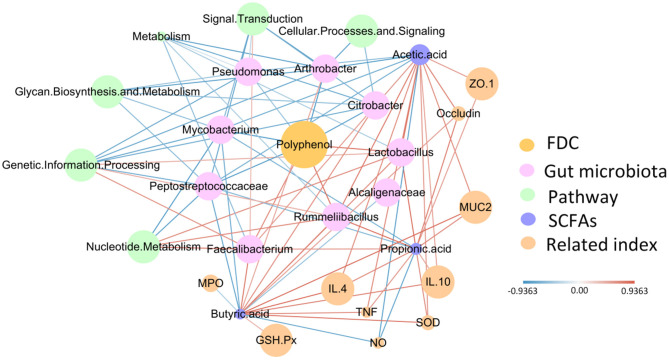
Figure 8.
The correlation network constructed with polyphenols, bacterial species, microbial metabolic pathways, SCFAs, the immune index, biomarkers of oxidative stress and the physical barrier index. The edge width and color (red, positive and blue, negative) are proportional to the correlation strength. The node size is proportional to the relative mean abundance.

