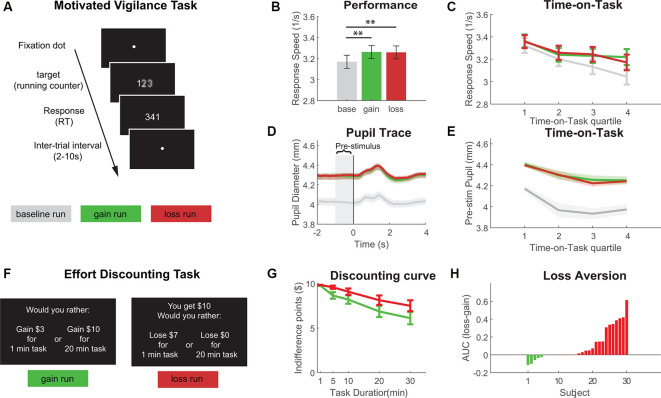
Figure 1.
Results from Experiment 1 with (A) schematic of the Motivated Vigilance Task, (B) response speed in the vigilance task for baseline, gain and loss conditions, (C) Time-on-Task decline of response speed (Time-on-Task quartiles for illustrative purposes, statistical analysis was based on linear slopes), (D) target-locked pupil trace in the vigilance task (time = 0 indicates target presentation), (E) Time-on-Task decline of pre-stimulus pupil diameter (Time-on-Task quartiles for illustrative purposes only, statistical analysis was based on linear slopes), (F) example trials of the effort-discounting task, (G) effort-discounting curve, and (H) loss-gain difference in the area under the discounting curve (AUC; positive difference scores denote less discounting for loss vs. gain choices). **p < 0.01.

