
Figure 2.
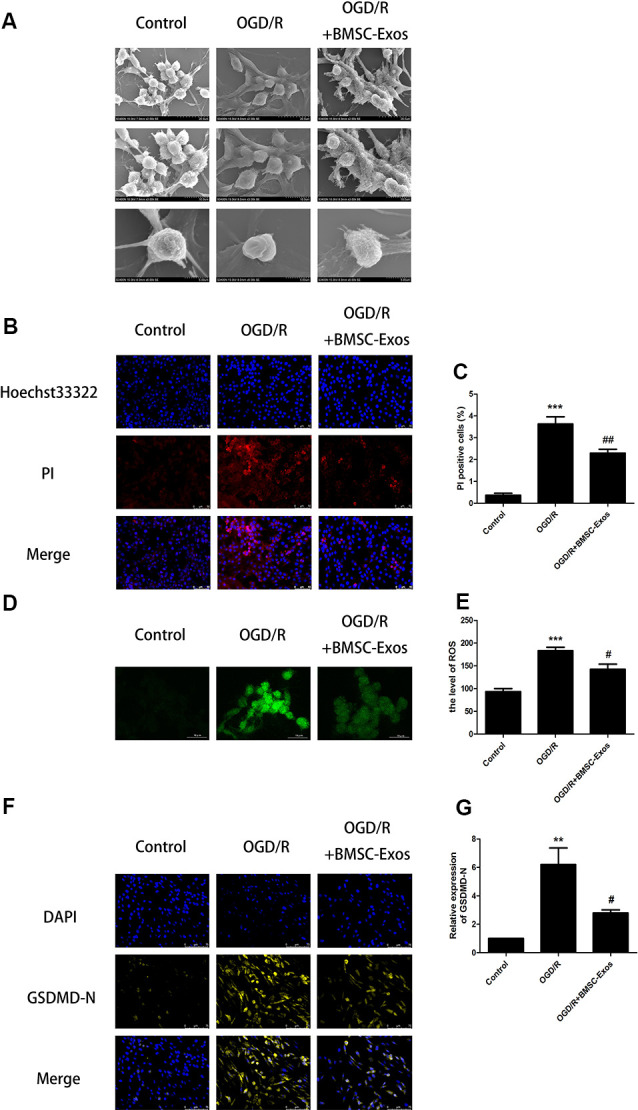
BMSC-Exos reduce pyroptosis induced by OGD/R. (A) Morphological changes of PC12 cells were observed using scanning electron microscopy (SEM); scale bar = 20/10/5 μm. (B) Representative images of Hoechst 33342/propidium iodide (PI) staining; scale bar = 50 μm. (C) PI-stained cells (red puncta) were quantified as the percentage of red puncta/total puncta signals in merged images (n = 3). PI-stained areas were lower in the BMSC-Exos group than in the OGD/R group (n = 3). (D) Representative images of reactive oxygen species (ROS); scale bar = 10 μm. (E) ROS levels are presented relative to control levels (n = 3). ROS levels in the BMSC-Exos group were lower than in the OGD/R group. (F) Representative immunofluorescence images; scale bar = 75 μm. (G) Relative expression levels of N-terminal of gasdermin D (GSDMD-N) were lower in the BMSC-Exos group than in the OGD/R group (n = 3). **p < 0.01, ***p < 0.001 vs. control group, #p < 0.05; ##p < 0.01 vs. OGD/R group.