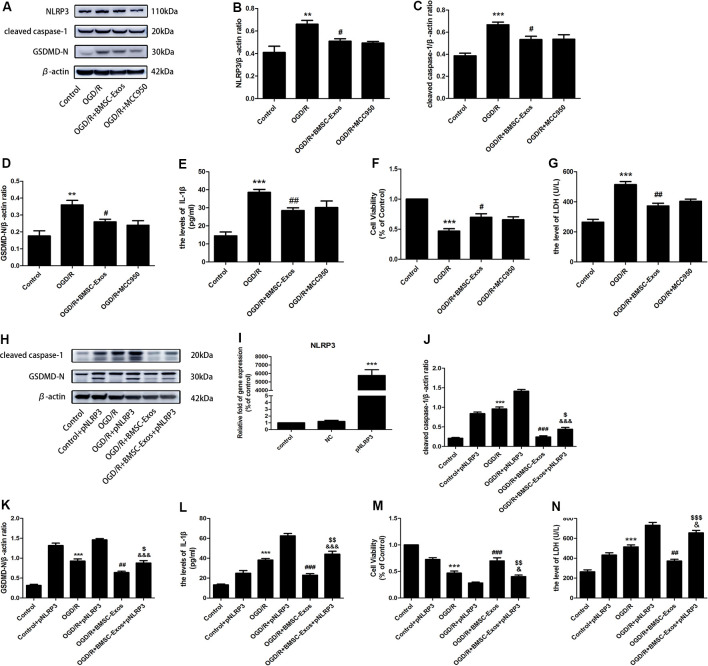
Figure 3.
BMSC-Exos reduce nucleotide-binding domain and leucine-rich repeat family protein 3 (NLRP3) inflammasome-mediated pyroptosis following OGD/R. (A) Representative Western blots of NLRP3, cleaved caspase-1, and GSDMD-N. (B–D) Expression levels of NLRP3, cleaved caspase-1, and GSDMD-N in the BMSC-Exos group were higher than in the OGD/R group, whereas no significant difference was observed between BMSC-Exos and MCC950 groups (n = 3). (E) Interleukin-1β (IL-1β) levels in the BMSC-Exos group were higher than in the OGD/R group, whereas no significant difference was observed between BMSC-Exos and MCC950 groups (n = 3). (F) No significant difference in cell viability was observed between BMSC-Exos and MCC950 groups (n = 3). (G) No significant difference in LDH release was observed between BMSC-Exos and MCC950 groups (n = 3). (H) Representative Western blots of cleaved caspase-1 and GSDMD-N. (I) Real-time quantitative polymerase chain reaction (RT-qPCR) showing the effects of pNLRP3 transfection (n = 3). (J,K) Expression levels of cleaved caspase-1 and GSDMD-N were higher in the BMSC-Exos+pNLRP3 group than in the BMSC-Exos group (n = 3). (L) IL-1β levels were higher in the BMSC-Exos+pNLRP3 group than in the BMSC-Exos group (n = 3). (M) Cell viability in the BMSC-Exos+pNLRP3 group was lower than in the BMSC-Exos group (n = 3). (N) LDH release in the BMSC-Exos+pNLRP3 group was higher than in the BMSC-Exos group (n = 3). **p < 0.01, ***p < 0.001 vs. control group; #p < 0.05, ##p < 0.01, ###p < 0.001 vs. OGD/R group; $p < 0.05, $$p < 0.01, $$$ p < 0.001 vs. OGD/R+BMSC-Exos group; &p < 0.05, &&&p < 0.001 vs. OGD/R+pNLRP3 group.

