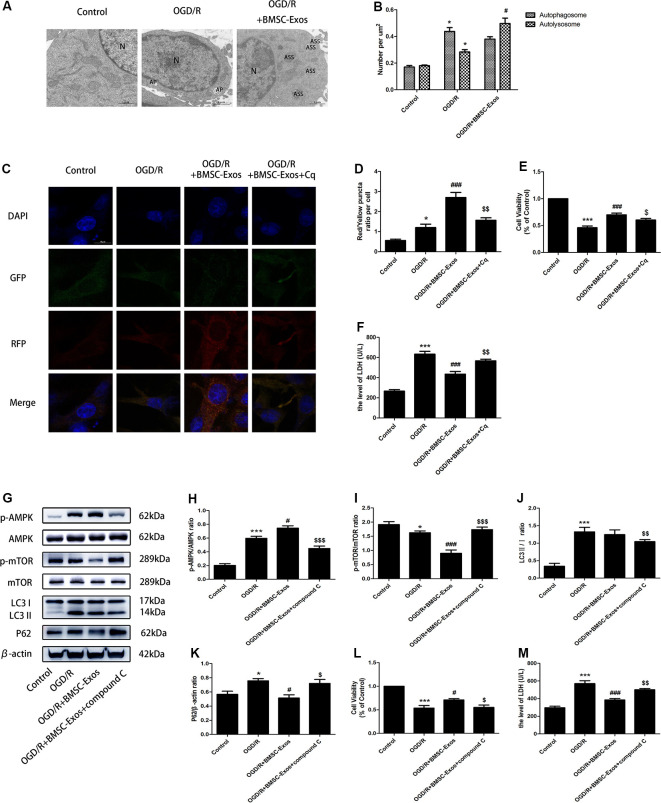
Figure 4.
BMSC-Exos promote autophagic flux through the AMP-activated kinase (AMPK)/mammalian target of rapamycin (mTOR) pathway following OGD/R. (A) Autophagic flux was detected using TEM. Typical cytoplasms and nuclei (N) in the control group; double-membrane autophagosomes (AP) were observed in the OGD/R group. Autolysosomes were darkly stained, indicating that autolysosomes (ASS) are activated in the OGD/R+BMSC-Exos group; scale bar = 1 μm. (B) Quantitative analysis of numbers of autophagosomes and autolysosomes in each treatment group (n = 3). Autophagosomes and autolysosomes were more numerous in the OGD/R group than in the control group, whereas larger numbers of autolysosomes were detected in the BMSC-Exos group. (C) Representative images of GFP-RFP-LC3 staining; scale bar = 10 μm. (D) Autophagy was quantified as the ratio of red puncta (GFP-RFP+) to yellow puncta (GFP+RFP+) in each cell. This ratio was higher in the BMSC-Exos group than in control and OGD/R groups (n = 3). (E,F) The autophagy inhibitor Cq reversed cell viability and LDH release (n = 3). (G) Representative Western blots of p-AMPK, AMPK, p-mTOR, mTOR, LC3 II/I and P62. (H–K) LC3 II/I and p-AMPK/AMPK expression increased, although P62 and p-mTOR/mTOR expression levels decreased in the OGD/R group when compared with the control group (n = 3). LC3 II/I expression did not change significantly after BMSC-Exos treatment, whereas p-AMPK/AMPK expression increased further and p-mTOR/mTOR and P62 expression levels decreased (n = 3). (L,M) The AMPK inhibitor compound C reversed the effects of OGD/R on cell viability and LDH release (n = 3). *p < 0.05, ***p < 0.001 vs. control group; #p < 0.05, ###p < 0.001 vs. OGD/R group; $p < 0.05, $$p < 0.01, $$$p < 0.001 vs.OGD/R+BMSC-Exos group.

