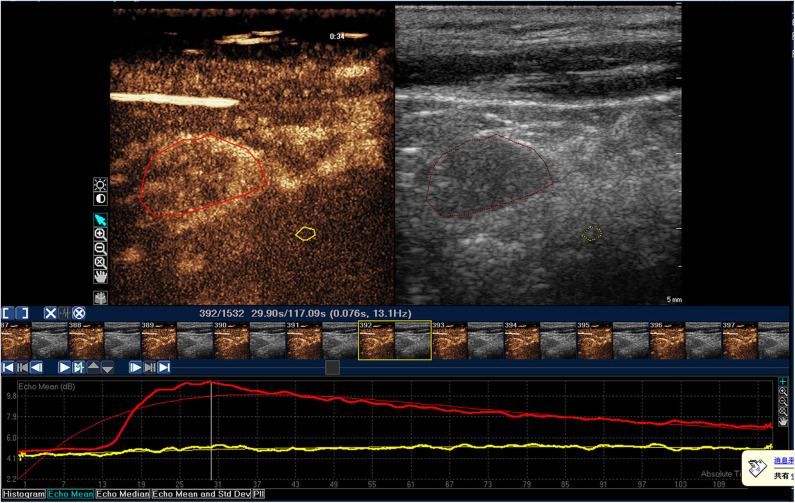
Figure 1.
Time-intensity curve of a typical benign lymph node in NPC patient. The red ROI is benign lymph node, and the red line is corresponding TIC curve. The yellow ROI is the tissue around the lesion, and the yellow line is the corresponding TIC curve. The benign lymph node was characterized by homogeneous enhancement.

