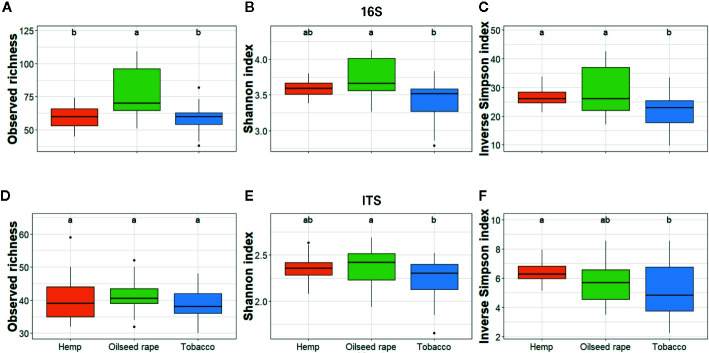
Figure 3.
Alpha diversity of bacterial and fungal seed communities. It was estimated as the Observed richness (A, D), Simpson index (B, E), and Inverse Shannon index (C, F) for both 16S (A–C) and ITS (D–F). The alpha diversity was measured for each biological replicate and is displayed per host of sampling. Different lowercase letters represent statistically different groups (Anova with post-hoc Tukey, p-value < 0.05).

