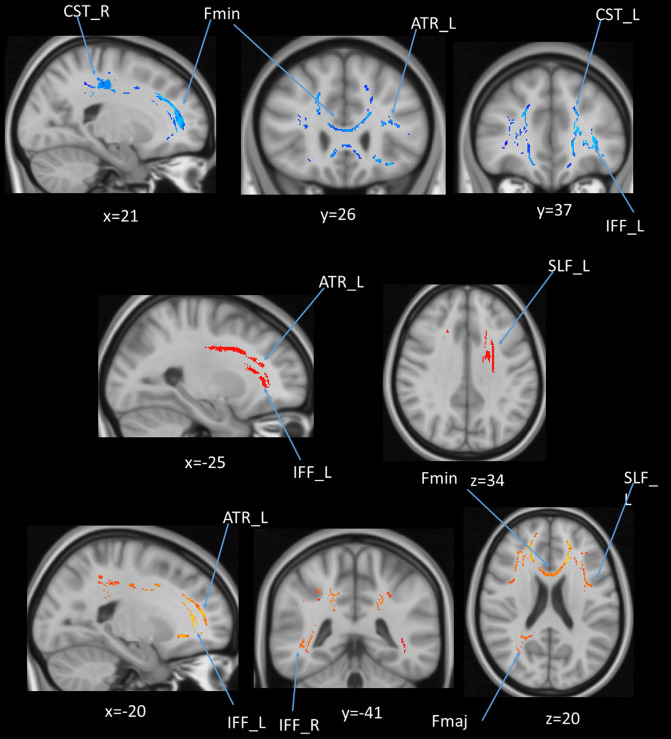
Figure 10.
(upper panel): Statistical map showing white matter clusters (blue) where FA was significantly negatively correlated with AHS; (middle panel): statistical map showing white matter clusters (red-yellow) where mean diffusivity (MD) was significantly positively correlated with AHS; (lower panel): statistical map showing white matter clusters (red-yellow) where radial diffusivity (RD) was significantly positively correlated with AHS. Axial slices are presented in radiological orientation (right = left). ATR, anterior thalamic radiation; CST, corticospinal tract; Fmin, forceps minor; Fmaj, forceps major; Fmin, forceps minor; IFF, inferior fronto-occipital fasciculus; SLF, superior longitudinal fasciculus.

