Figure 3.

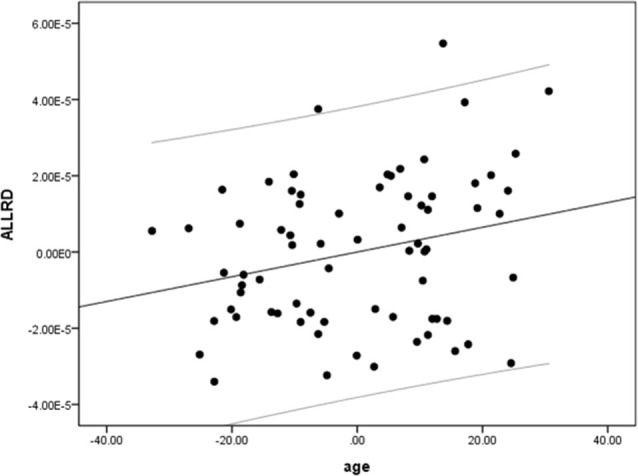
A positive correlation between age and radial diffusivity (RD). Scatterplot with regression line between age and RD regressing out variance attributed to gender, education, and scores of MoCA and BDI-II.

A positive correlation between age and radial diffusivity (RD). Scatterplot with regression line between age and RD regressing out variance attributed to gender, education, and scores of MoCA and BDI-II.