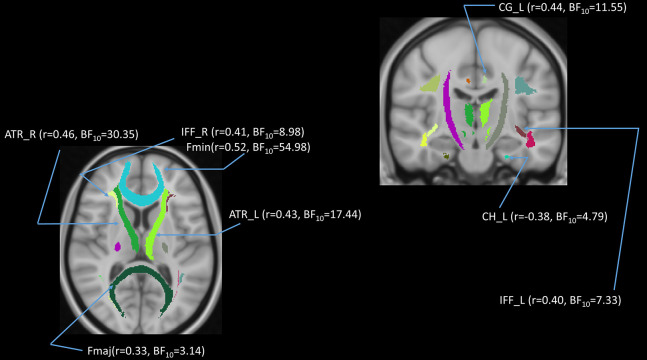
Figure 9.
Partial correlations (controlling for gender, education, and scores of MoCA and BDI-II) between age and radial diffusivity (RD) in 8 out of 18 white matter tracts. Note: r = partial correlation value, BF10 = Bayes factor for the presence of a correlation; L = left hemisphere; R = right hemisphere. ATR, anterior thalamic radiation; CG, cingulum; CH, cingulum of the hippocampus; Fmaj, forceps major; Fmin, forceps minor; IFF, inferior fronto-occipital fasciculus; ILF, inferior longitudinal fasciculus. Note: colors in the figure represent the different tracts of interest.

