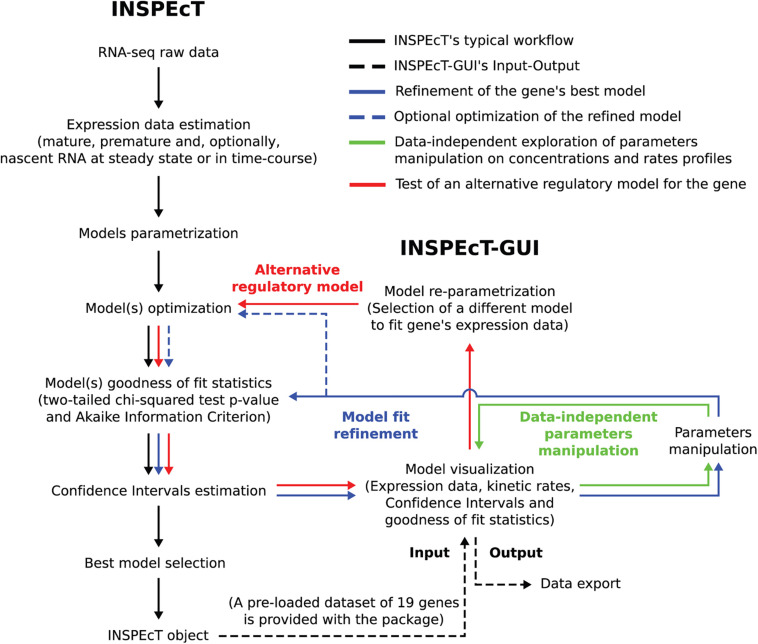
FIGURE 2.
Flowchart illustrating how INSPEcT-GUI integrates with and extend the functionalities implemented in INSPEcT. Black arrows trace the typical INSPEcT pipeline, from raw RNA-seq data to an INSPEcT object containing, for each gene in the dataset, the modeled kinetic rates together with the goodness of fit statistics. Dashed black arrows depict the Input of an INSPEcT object to INSPEcT-GUI and the output of the latter. Green arrows indicates how the GUI can be used, without the need of any data, for the manipulation of model’s parameters to observe the effect on the profiles of RNA species and kinetic rates. Solid blue arrows indicate how the GUI can be used to manipulate a model’s parameters, thus refining the INSPEcT model through the reassessment of goodness of fit statistics and confidence intervals. Dashed blue arrows indicate how also the numerical optimization can optionally be updated. Red arrows indicate how the GUI can be used to implement an alternative regulatory model (i.e., switching between the functions of Figure 1 for one of more rates), which is subsequently optimized and tested.

