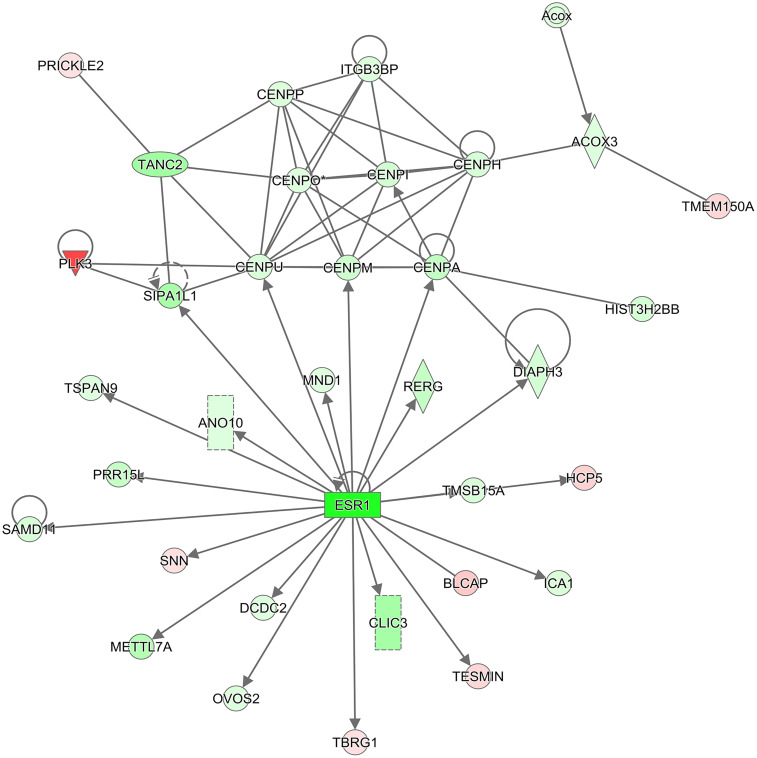
FIGURE 2.
IPA molecular interaction network. The 2,197 DEGs (2,604 transcripts) from the comparison of Topotecan at 24 h vs. control at 24 h were used to generate the top scoring (–log10 p-value = 38) molecular interaction network containing 34 focus molecules. The intensity of the colors represents the fold change of expression; red is up-regulated, and green is down-regulated. The shapes represent molecular entities; diamond: enzyme, oval: transcription regulator, triangle: kinase, rectangle: ligand-dependent nuclear receptor, double circle: complex group, circle: other. Solid lines denote a direct interaction. An arrow symbolizes activation and a line with no arrow signifies a protein-protein interaction.

