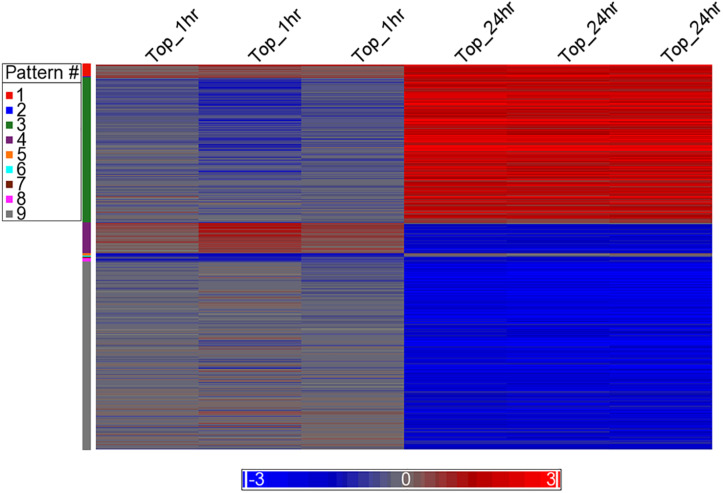
FIGURE 3.
Heat map of the expression of the co-expressed genes. The log2 ratio values of the 1,132 co-expressed genes categorized to the nine EPIG patterns are represented as a heat map. Red is up-regulated, blue is down-regulated, and gray is no change. The color legend depicts the relative expression change (each sample to the average of the time-matched control). The x-axis is the samples and the y-axis are the genes grouped into the nine patterns colored according to the pattern # legend.

