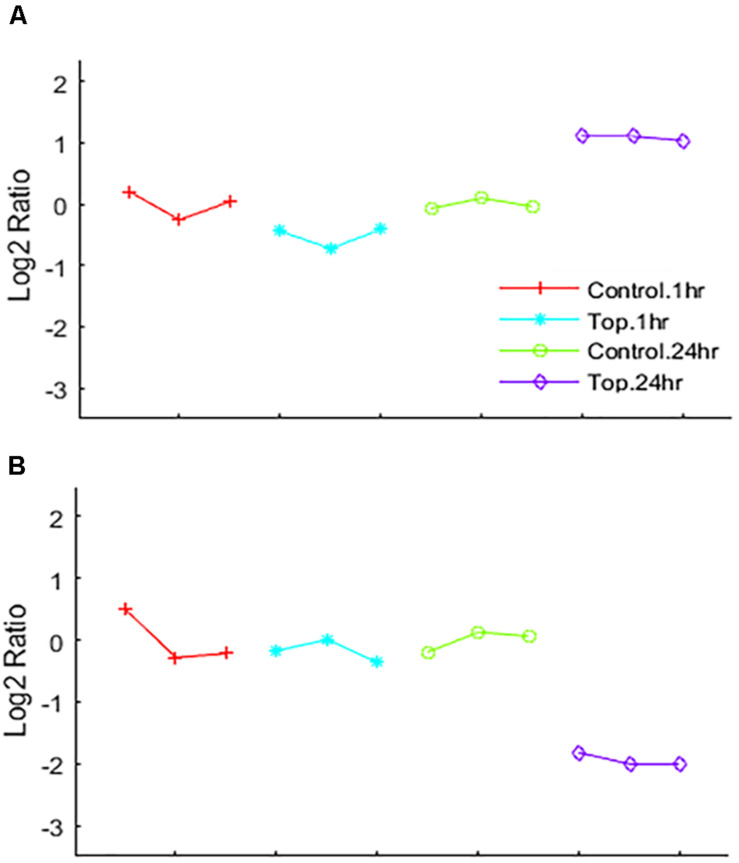
FIGURE 5.
EPIG patterns. Expression patterns of genes co-expressed by (A) up-regulation by Topotecan (pattern #3 represents 426 genes) and (B) down-regulation by Topotecan (pattern #9 represents 552 genes). The x-axis is the biological samples that are color coded and represented by symbols as depicted in the legend. The y-axis is the log2 ratio.

