
Figure 2.
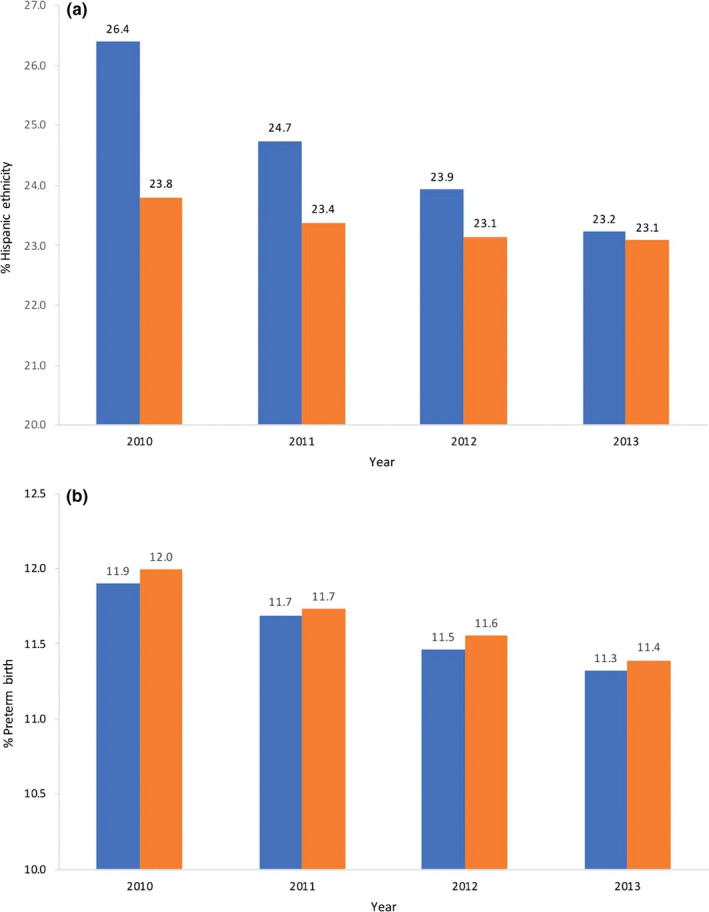
Comparison of the representativeness of select items from revised states (blue) versus the United States overall (orange), 2010‐2013. A, Per cent reporting Hispanic ethnicity. B, Preterm birth rates. Information is available in Table D of the User Guide to the Natality Public Use file for each corresponding year (www.cdc.gov/nchs/data_access/vitalstatisticsonline.htm)