
Figure 1.
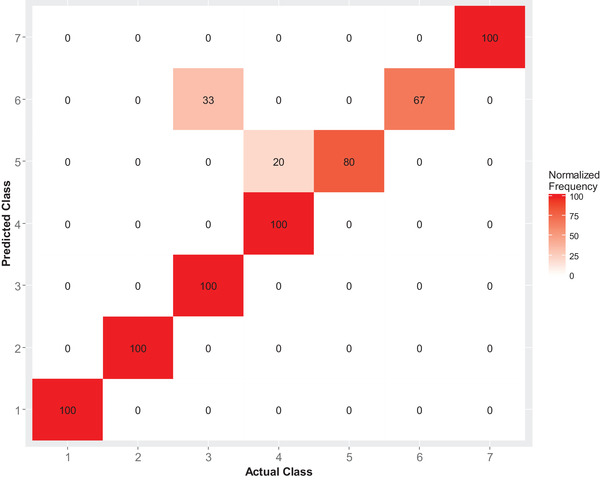
Cross‐tabulation of the actual and predicted classes for the predictions from the support vector machine model normalized as a percentage.
Official websites use .gov
A
.gov website belongs to an official
government organization in the United States.
Secure .gov websites use HTTPS
A lock (
) or https:// means you've safely
connected to the .gov website. Share sensitive
information only on official, secure websites.
Cross‐tabulation of the actual and predicted classes for the predictions from the support vector machine model normalized as a percentage.