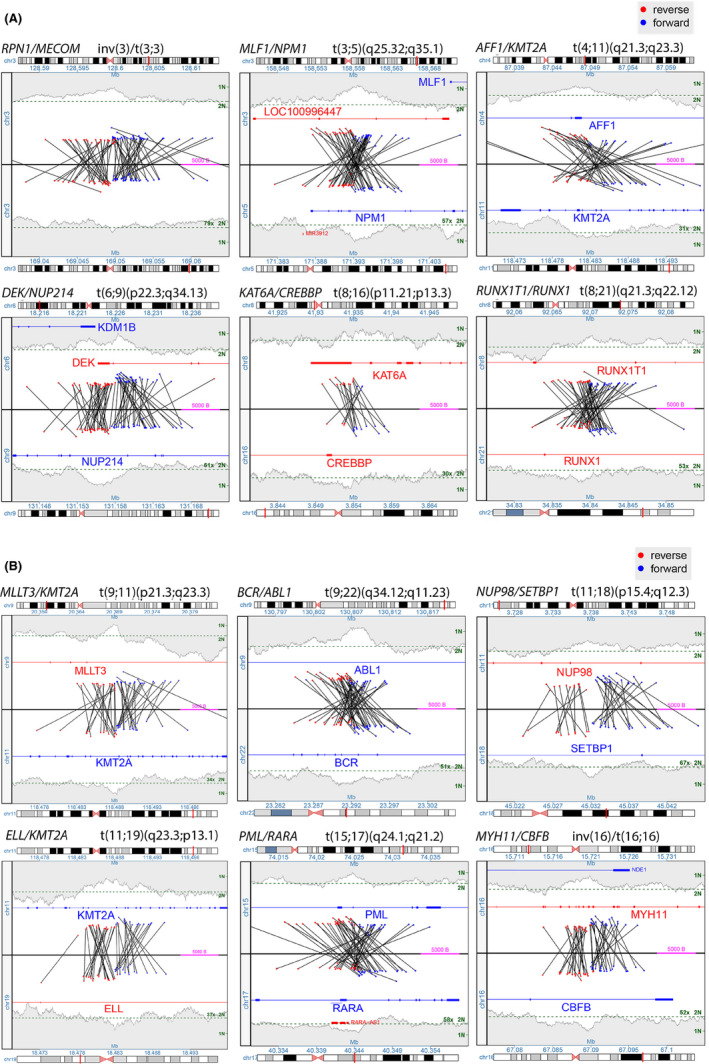
Figure 2.

(panel A and B) Representative junction plots of the classic‐AML rearrangements to be detected by this assay. Each junction plot shows the lowest number chromosome on the top and the higher number on the bottom. Each black line represents a junction between two rearranged fragments with blue in the forward orientation and red in the reverse. Copy state is shown by the gray shaded area on the far top and bottom of the plot. All this data taken together allows for reconstruction of the abnormal region
