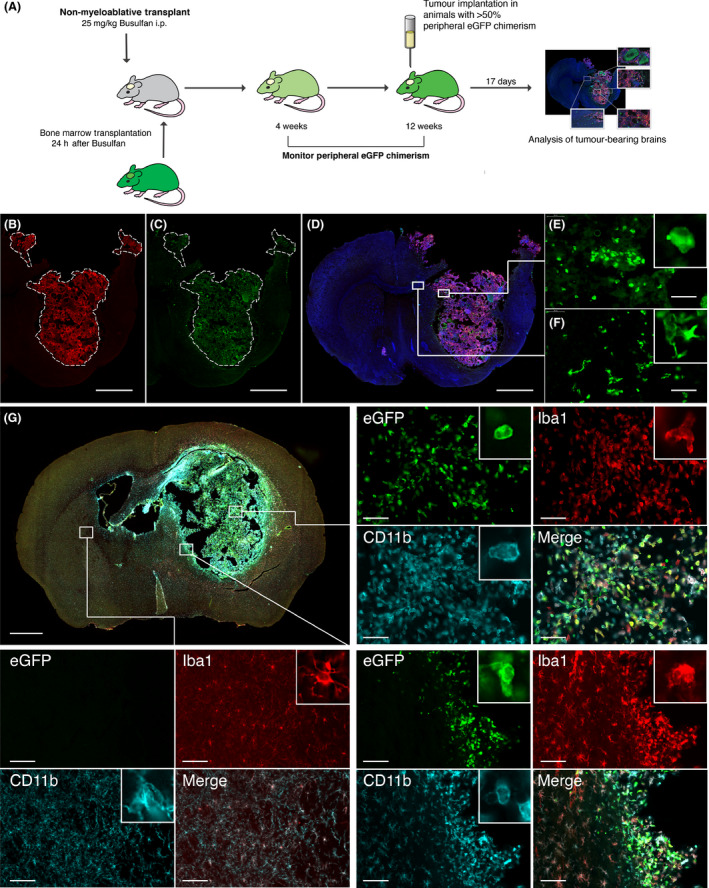
Figure 2.

Immunofluorescent staining of syngeneic GL‐261 tumours in nonmyeloablative transplant mice. (A) Schematic diagram showing the experimental design using Nonmyeloablative transplantation with Busulfan at 25 mg/kg followed by implantation of GL‐261 tumour 12 weeks later, and brain harvest 17 days post implantation. (B) Anti‐DsRed staining in a chimerised animal implanted with GL‐261_DSX2 tumours. White dotted line delineates tumour border (scale bar = 1000 μm). (C) Anti‐eGFP staining to demonstrate BMDC within the brain of a chimerised animal; peripheral eGFP + cells are mainly confined to within the tumour mass. (D) 30 μm thickness coronal section of tumour bearing brain. Combined merged image of anti‐DsRed (tumour), anti‐eGFP (BMDC) and DAPI (nuclei). (E) X40 high powered field of intratumoural region demonstrating infiltrating eGFP + BMDC (scale bar = 100μm). (F) Intraparenchymal, peritumoural region showing lesser degree of eGFP + BMDC infiltration. (G) Merged picture of anti‐eGFP staining (Green ‐ BMDC), anti‐Iba1 staining (Red ‐ microglia/macrophage) and anti‐CD11b (Cyan ‐ myeloid cells) staining. Four quadrant high powered fields (X40) demonstrating staining pattern for each region of interest (white boxes). Upper Right Panel: Intratumoural region of interest. Bottom Right Panel ‐ Peritumoural region of interest. Bottom Left Panel – Nontumour brain parenchyma in contralateral hemisphere. Inset within each panel shows representative cell morphology.
