
Figure 4.
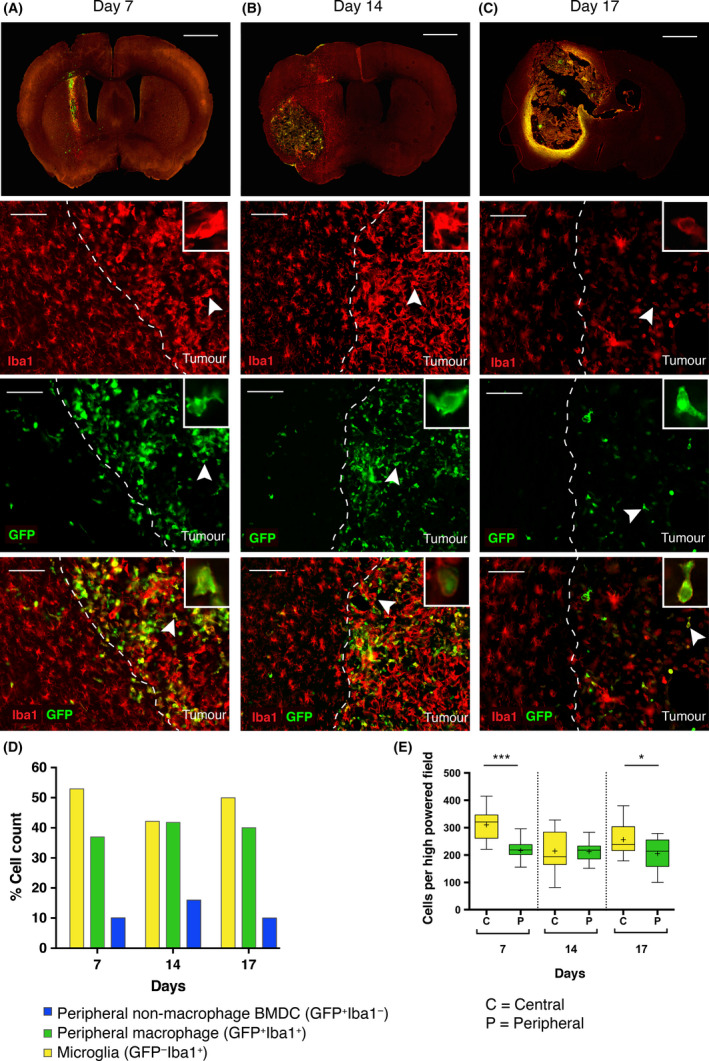
Time course experiment quantifying the number of eGFP + and Iba1+ cells present within the tumour mass over time. (A–C) Vertical panels represent cells at the tumour margin (dashed white line) on Day 7, 14 and 17, respectively. From top to bottom: First row = 30 μm thickness coronal section of tumour bearing brain (scale bar = 1000 μm). Second row = Iba1 staining with highlighted cell (inset) to demonstrate morphology (scale bar = 100 μm). Third row = eGFP staining demonstrating eGFP + BMDC located within the tumour margin. Fourth row = merged image of Iba1 and eGFP staining. A significant number of Iba1+/eGFP −(yellow) microglial cells within the tumour, Iba1+/eGFP + double positive (green) cells represent peripheral macrophages are almost found exclusively within tumour, and Iba1−/eGFP + (blue) cells represent non‐macrophage BMDC within the tumour. (D) Total cell counts: The majority of infiltrating cells are Iba1+/eGFP − (microglia). The next most frequently seen population are Iba1+/eGFP + (peripheral macrophage), followed by Iba1−/eGFP + (nonmacrophage BMDC) which is present at all time points, suggesting the presence of nonmacrophage derived haematopoietic cells within the tumour. BMDC infiltration (eGFP +) occurs early in disease and the overall proportions do not significantly vary over the time course. (E) Analysis of microglia vs. peripheral macrophage cell counts demonstrates a consistently higher microglial population, which is significantly greater than the peripheral macrophage population at Day 7 (*** = P < 0.0001) and at Day 17 (* = P < 0.05). There is no significant difference between microglial and peripheral macrophage cell counts at day 14.