
Figure 5.
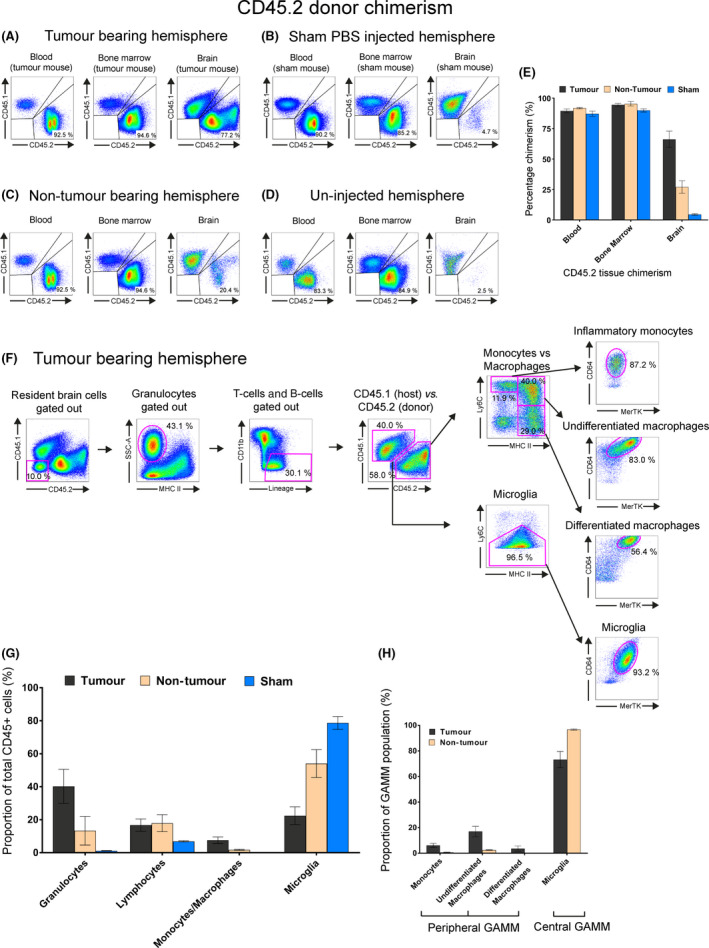
Characterising immune cell populations by flow cytometry in GL‐261‐implanted CD45.1/eGFP‐CD45.2 nonmyeloablative transplant mice. All flow plots used the initial gating strategy outlined in Figure S7A to show live singlet CD45+ cells. (A–D) Chimerism comparison in blood, bone marrow and brain of tumour bearing hemisphere, sham‐PBS injected hemisphere, contralateral nontumour bearing hemisphere of mice implanted with GL‐261 cells and uninjected brain of chimeric mouse. Quadrant plots were used to show the relative proportion/chimerism of CD45.2 (donor) vs. CD45.1 (host) cells. (E) Relative CD45.2 donor chimerism of blood, bone marrow and brain in a tumour bearing hemisphere (black), the contralateral nontumour bearing hemisphere in the same animal (beige) and sham‐injected hemisphere of a different animal (blue). (F) Gating strategy used to identify multiple tumour‐tropic immune cells within the tumour bearing hemisphere of a mouse. Host cells were distinguished from peripheral donor cells using CD45.1 and CD45.2 marker expression, respectively. Sequential gating strategies using SSC/MHCII and CD11b/lineage depletion was used to remove granulocytes, T‐cell and B‐cells to obtain a GAMM population. Downstream gating with Ly6C/MHCII/MerTK/CD64 was then used to characterise GAMM. (G) Relative proportions of each immune cell type. Immune cell types identified included: granulocytes, lymphocytes (T and B‐cells) and GAMMs. GAMMs were further subdivided into inflammatory monocytes, undifferentiated macrophages, differentiated macrophages and microglia. (H) Proportion of subpopulations found within GAMMs in tumour (black) and nontumour bearing (brown) hemispheres.