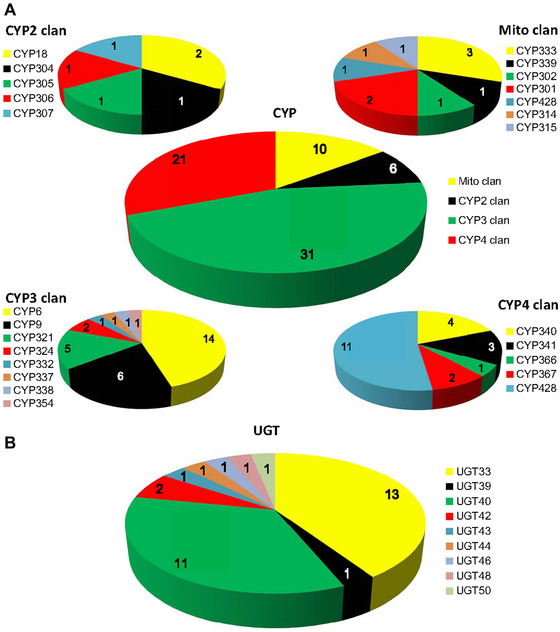
Figure 1.

Pie chart showing the number and distribution of P450 (A) and UDP‐glucuronosyltransferase (UGT) genes (B) in Spodoptera exigua. (A) In the upper big pie chart, the red, green, yellow and black sections represent clans of CYP4, CYP3, Mito and CYP2, respectively. Four small pie charts describe the distribution of genes in the family. (B) In the pie chart, nine different colors represent nine families of the UGT, respectively.
