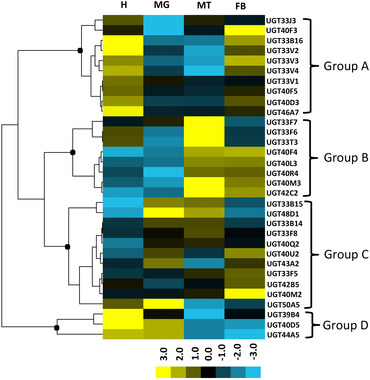
Figure 5.

Tissue expression patterns of the UDP‐glucuronosyltransferases (UGTs) from Spodoptera exigua in different larval tissues. Total RNA isolated from four major tissues, and specific primers designed based on UGT sequences were used in quantitative real‐time polymerase chain reaction to quantify mRNA levels of all the 32 UGTs. Relative messenger RNA (mRNA) levels were calculated by comparing the P450 mRNA levels to internal standard glyceraldehyde‐3‐phosphate dehydrogenase (GAPDH) gene mRNA levels. For each tissue, there were three biological replicates. The mean normalized values were displayed using Cluster 3.0 program and TreeView, and genes were clustered in terms of their expression patterns using the similarity metric of Euclidean distance and clustering method of complete linkage. The yellow represents high expression values while blue represents low expression values. H, head; MG, midgut; MT, Malpighian tubule; FB, fat body.
