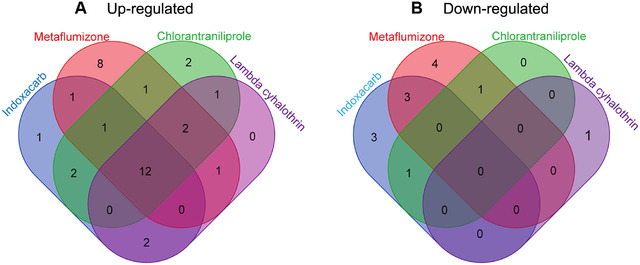
Figure 8.

Venn diagram representing the overlapping of induction responses of Spodoptera exigue P450s and UDP‐glucuronosyltransferases (UGTs) by four insecticides. In the Venn diagram, the blue petal shows that the number of the P450s and UGTs were induced by indoxacarb. The other three colors are used to distinguish the remaining three insecticides: red for metaflumizone, green for chlorantraniliprole and purple for lambda‐cyhalothrin, respectively.
