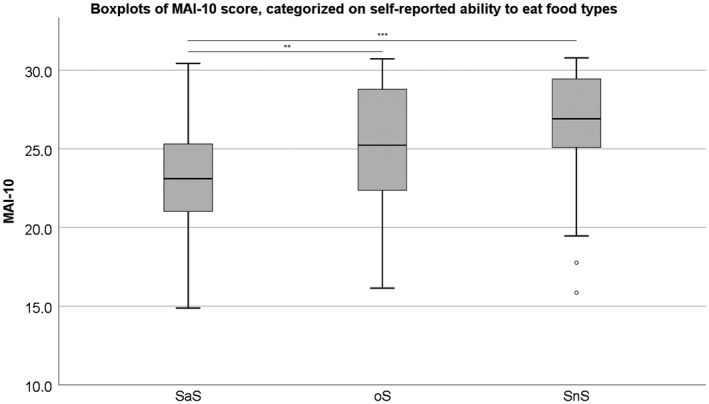
Figure 2.

The outcome of the three food consistency groups when performing the MAI‐20. *P < 0.05; **P < 0.01; ***P < 0.001. °: Outlier. SaS: reported ‘Unlikely’ to have problems with solid or soft food types; oS: only ‘Likely’ to have problems with solid food types; Neither SnS: reported ‘Likely’ to have problems with both solid and soft food types
