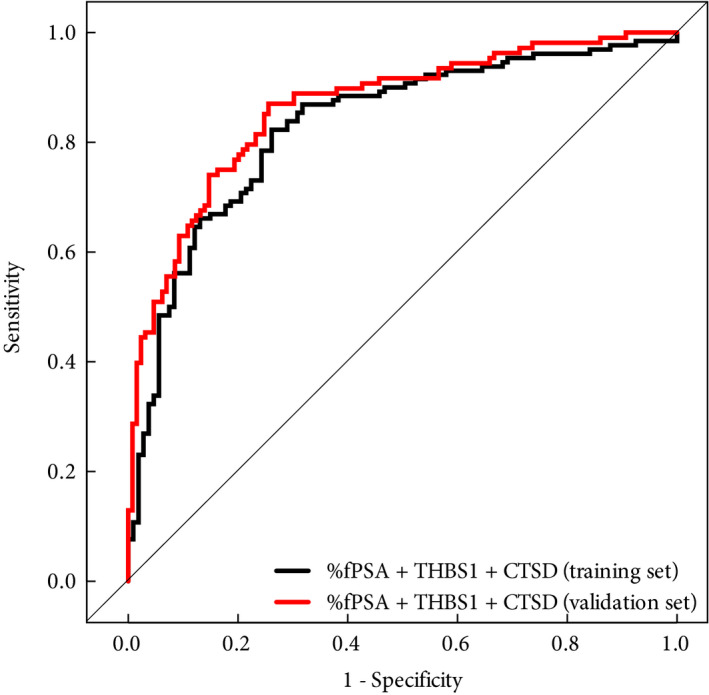
Figure 1.

Receiver‐operating characteristic curves of the multivariate logistic regression model including percentage of free PSA to total PSA ratio ( %fPSA), thrombospondin 1 (THBS1 ) and cathepsin D (CTSD) in the training (black line) and validation (red line) sets for predicting biopsy outcome.
