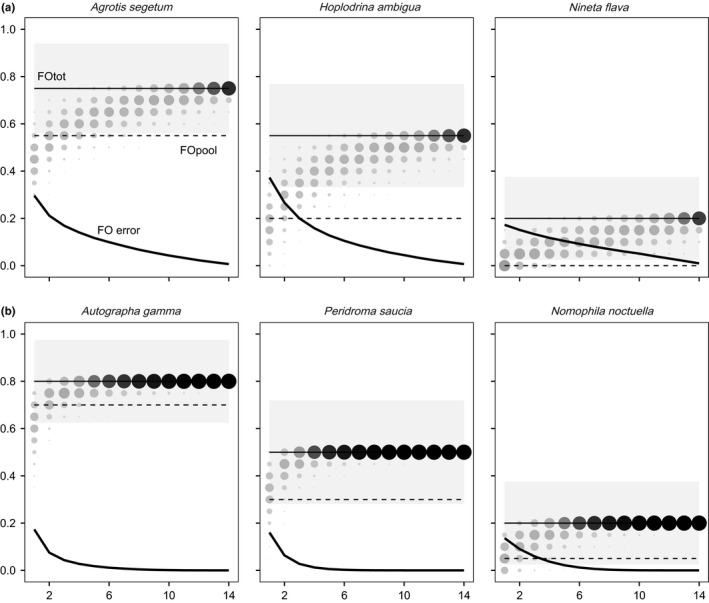
Figure 3.

Variation in the empirical distribution of frequency of occurrence (FO) estimates (circles), in relation to the number of pellets analysed per individual, for prey items with low (a) and high (b) intraindividual FO (FOpel). Thin black lines are the FO of prey items estimated from the analysis of 15 pellets per individual (FOtot) and light shaded areas the corresponding binomial confidence interval. Thick black lines represent the mean error of FO estimates. Dashed lines represent estimated FO from pools (FOpool)
