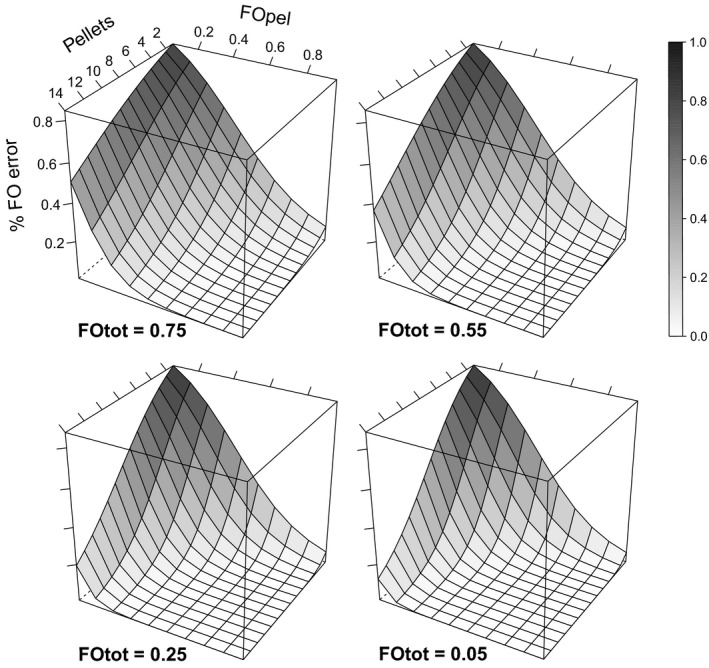
Figure 4.

Fitted response surfaces inferred from a beta regression model showing how the error rates of frequency of occurrence (FO) estimates of prey items in the diet of European free‐tailed bats varied in relation to the number of pellets analysed and the mean frequency of occurrence of the prey items within individuals that consumed that prey (FOpel), at four levels of the frequency of occurrence of the prey items in the overall bat sample (FOtot, n = 20)
