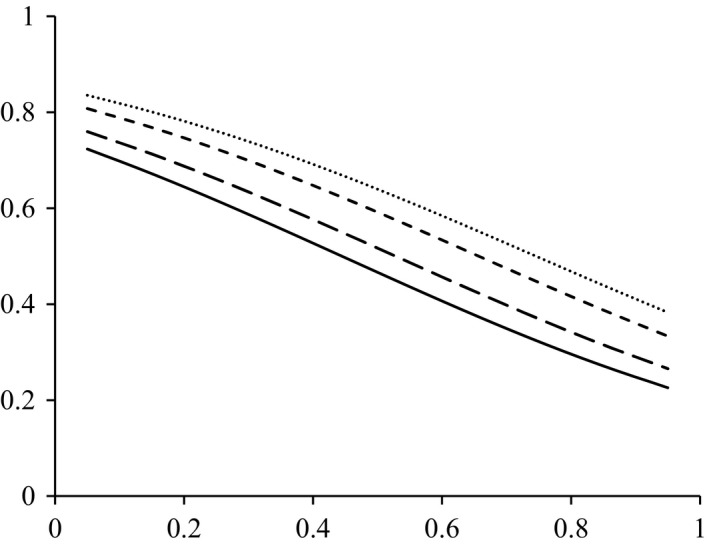
Figure 5.

Fitted response curves inferred from a beta regression model showing how the error rates of frequency of occurrence (FO) estimates of prey items in pooled samples varied in relation to the frequency of occurrence within the pellets of individual bats (FOpel), at four levels of the frequency of occurrence of the prey items in the overall bat sample (n = 20; FOtot = 0.75, 0.55, 0.25 and 0.05 for black line, large dash line, small dash line and point line, respectively)
