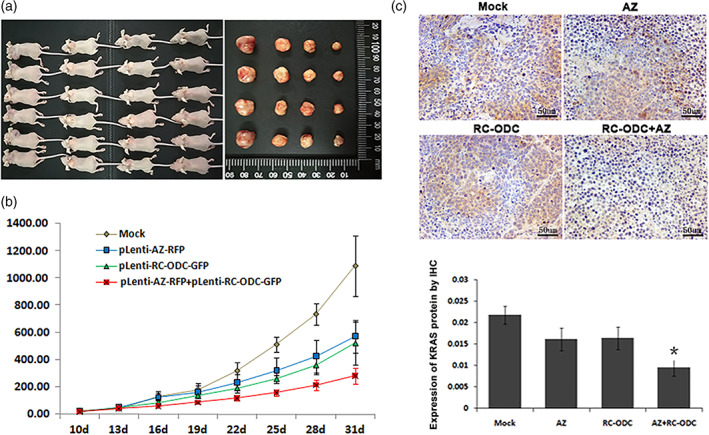
Figure 4.

Co‐expression of RC‐ODC and AZ suppressed tumorigenicity in vivo. (a) The gross morphology of the tumors from the four groups of six mice each is shown. (b) A significant difference in tumor volume was detected among the groups starting on the 19th day (P < 0.05). (c) Tumor tissues were subjected to immunostaining analysis of the KRAS protein, and the group co‐treated with RC‐ODC and AZ showed relatively weaker cytoplasmic expression of KRAS compared with the mock and control groups. The quantitative analysis of KRAS protein levels is also shown.
