
Figure 3.
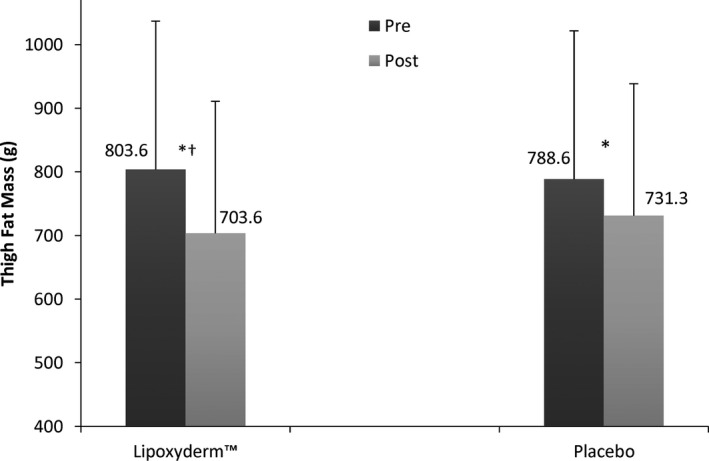
Thigh fat mass pre and post comparison of LD and PLA. *Significant difference pre to post (P < 0.002); †Significant difference for Lipoxyderm™ vs placebo pre to post (P = 0.001)
Official websites use .gov
A
.gov website belongs to an official
government organization in the United States.
Secure .gov websites use HTTPS
A lock (
) or https:// means you've safely
connected to the .gov website. Share sensitive
information only on official, secure websites.
Thigh fat mass pre and post comparison of LD and PLA. *Significant difference pre to post (P < 0.002); †Significant difference for Lipoxyderm™ vs placebo pre to post (P = 0.001)