
Figure 6.
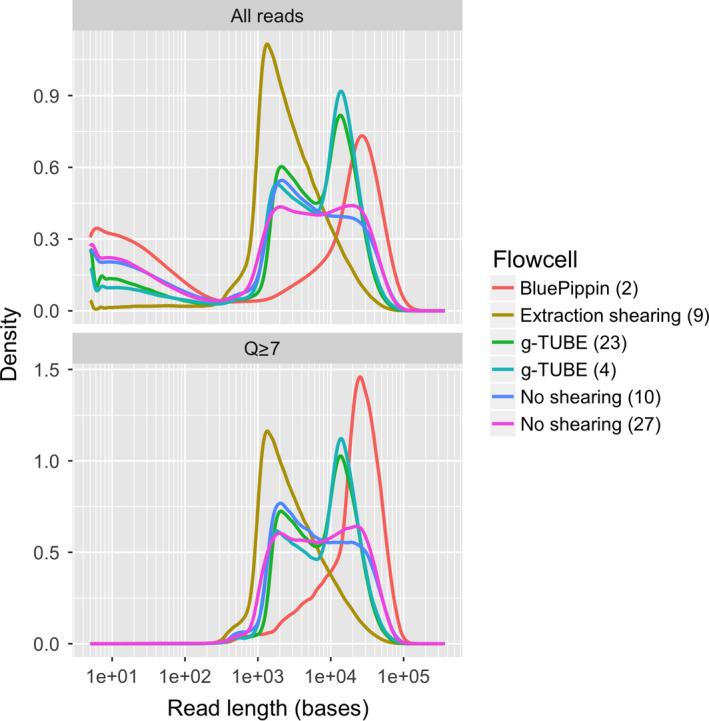
The impact of DNA extraction protocol on the distribution of read lengths from ONT sequencing. Each line represents the read‐length distribution for a single flowcell. The x‐axis shows the read lengths on a log scale, and the y‐axis shows the density of reads at a particular length. The top panel shows data for all reads, and the bottom panel shows the same data, but with reads that have a mean quality (Q) score <7 removed [Colour figure can be viewed at wileyonlinelibrary.com]