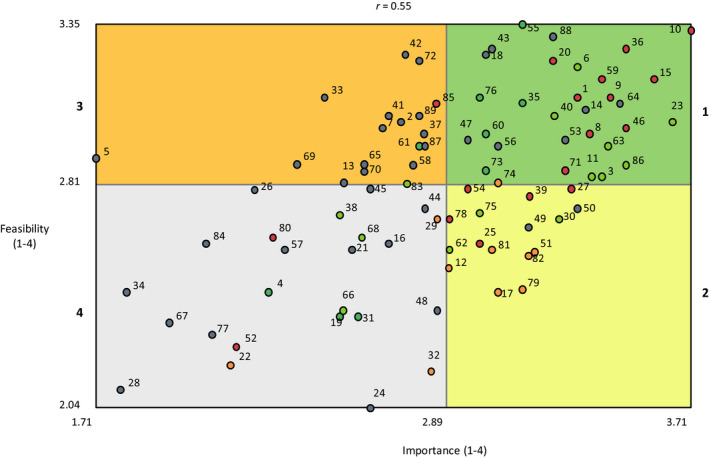
Figure 4.

The “Go‐Zone” graph showing ratings of importance and feasibility. The top right quadrant indicates the Go‐Zone, including statements that were rated above the mean for both importance and feasibility. Go‐Zone quadrants: 1 = Top right; 2 = Bottom right, 3 = Top left; 4 = Bottom left. The statements in the Go‐Zone (quadrant 1) represent the most actionable statements
