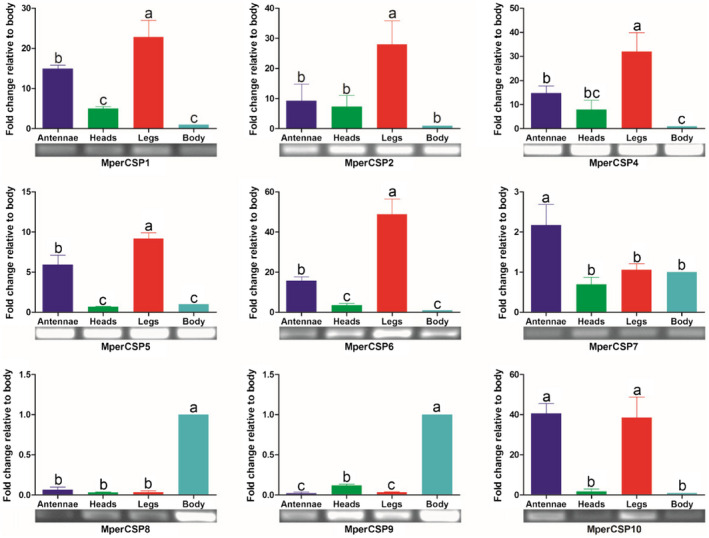
Figure 10.

Myzus persicae chemosensory protein (CSP) transcript levels in different tissues assessed by reverse transcription PCR and quantitative real‐time PCR. The error bars present the standard error, and the different letters (a, b, c) indicate significant differences (p < 0.05). This figure was presented using GAPDH as reference gene to normalize the target gene expression and correct sample‐to‐sample variation; similar results were also obtained with β‐actin as reference gene. The standard error is represented by the error bar. [Colour figure can be viewed at wileyonlinelibrary.com]
