
Figure 2.
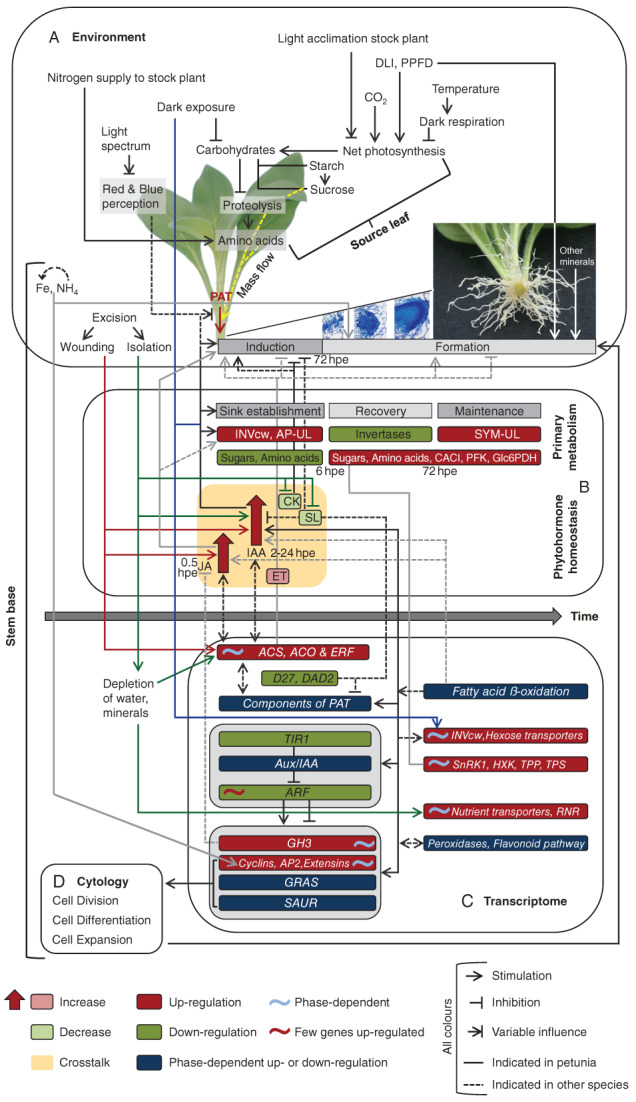
Current concept of the hormonal, metabolic and environmental regulation of AR formation in petunia cuttings, distinguishing between the levels of (A) environment, (B) primary metabolism and phytohormone homeostasis, (C) transcriptome and (D) cytology. Full lines in different colors indicate mechanistic relationships between environmental factors and diverse endogenous components, while arrowheads, crossbars or combination of both indicate stimulating, inhibitory or variable influences, respectively. Broken lines indicate hypothesized influences based on the literature on other plant species. Small pink and light green boxes indicate presumed increases and decreases in hormone levels, respectively, based on the literature on other plant species. Ochre shading indicates hormonal crosstalk. Rooting phases and the responses of plant metabolism and hormone homeostasis in the stem base are assigned to the time axis, while important time points under standard rooting conditions (Ahkami et al. 2009, 2013) are indicated as hours post excision (hpe). Red and green boxes indicate preferential up‐ vs down‐regulation of gene families or groups (in italic), metabolite levels or enzymatic activities. Dark blue boxes indicate gene families/groups whose up‐ or down‐regulation is generally phase dependent. Sinusoids indicate that specific genes within the box are upregulated (red color) or show phase dependency of upregulation (blue color). For gene or enzyme names, see the abbreviation list.